
Viewing Server Monitoring Metrics
Scenarios
This topic describes how to view server monitoring metrics, including fine-grained OS metrics collected by the Agent and basic ECS metrics.
For details, see Services Interconnected with Cloud Eye.
Prerequisites
You have installed the Agent. For details, see Installing and Configuring the Agent.
Procedure
- Log in to the management console.
- Click Service List in the upper left corner, and select Cloud Eye.
- View ECS or BMS metrics.
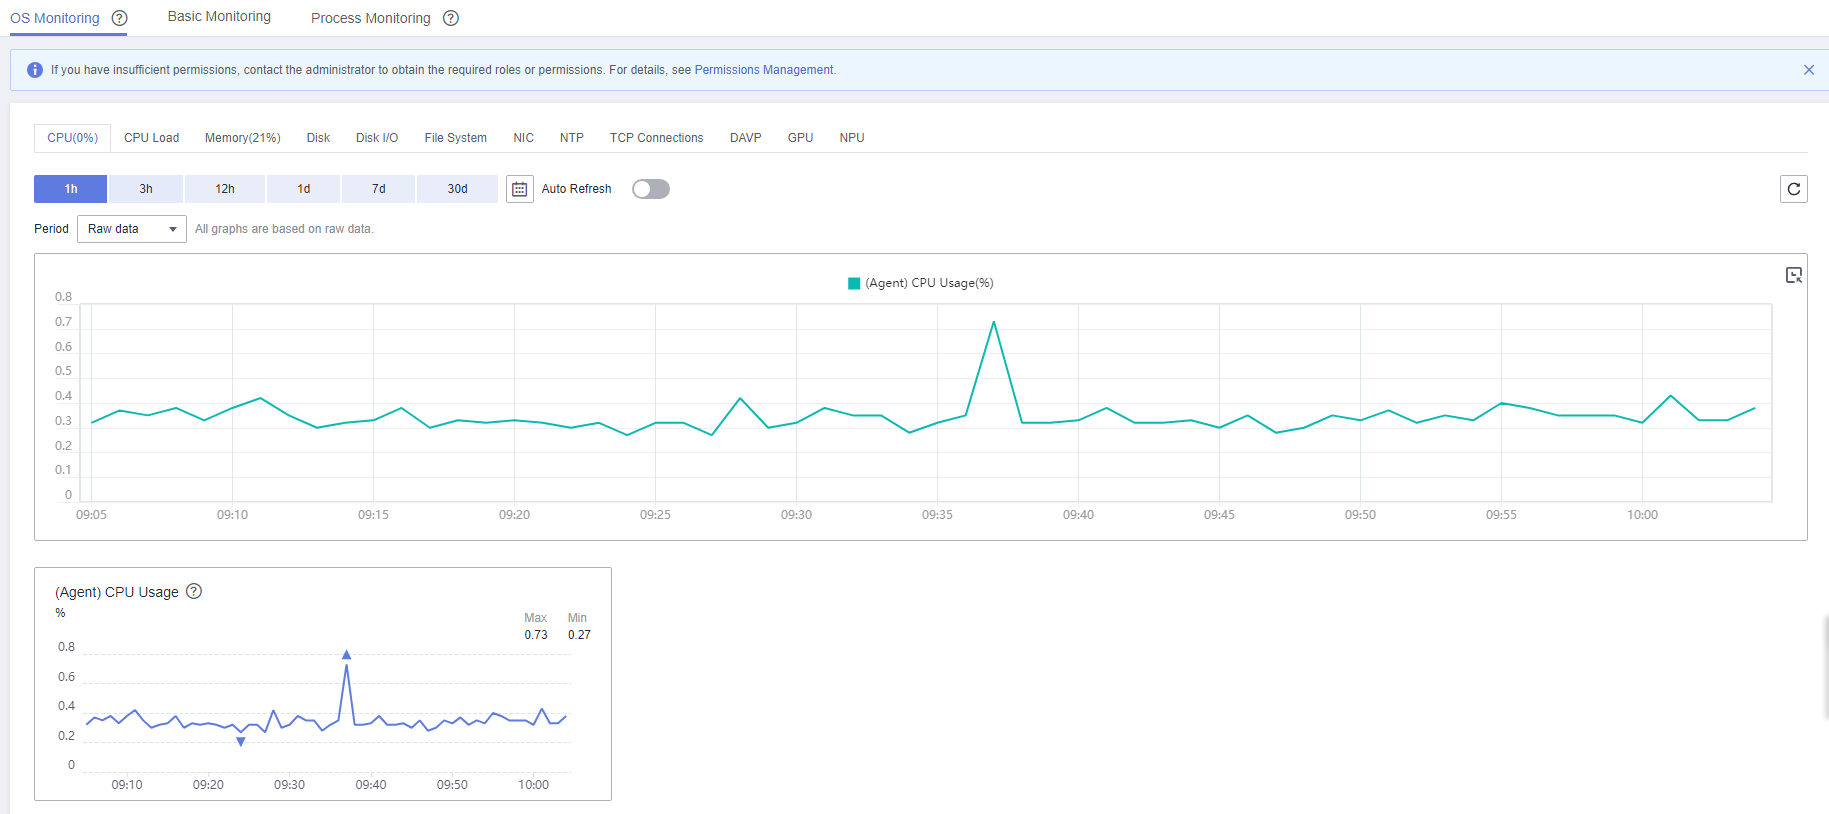
- To view OS monitoring metrics of an ECS, in the left navigation pane, choose Server Monitoring > Elastic Cloud Server, locate the ECS, and click View Metric in the Operation column.
Figure 1 OS Monitoring
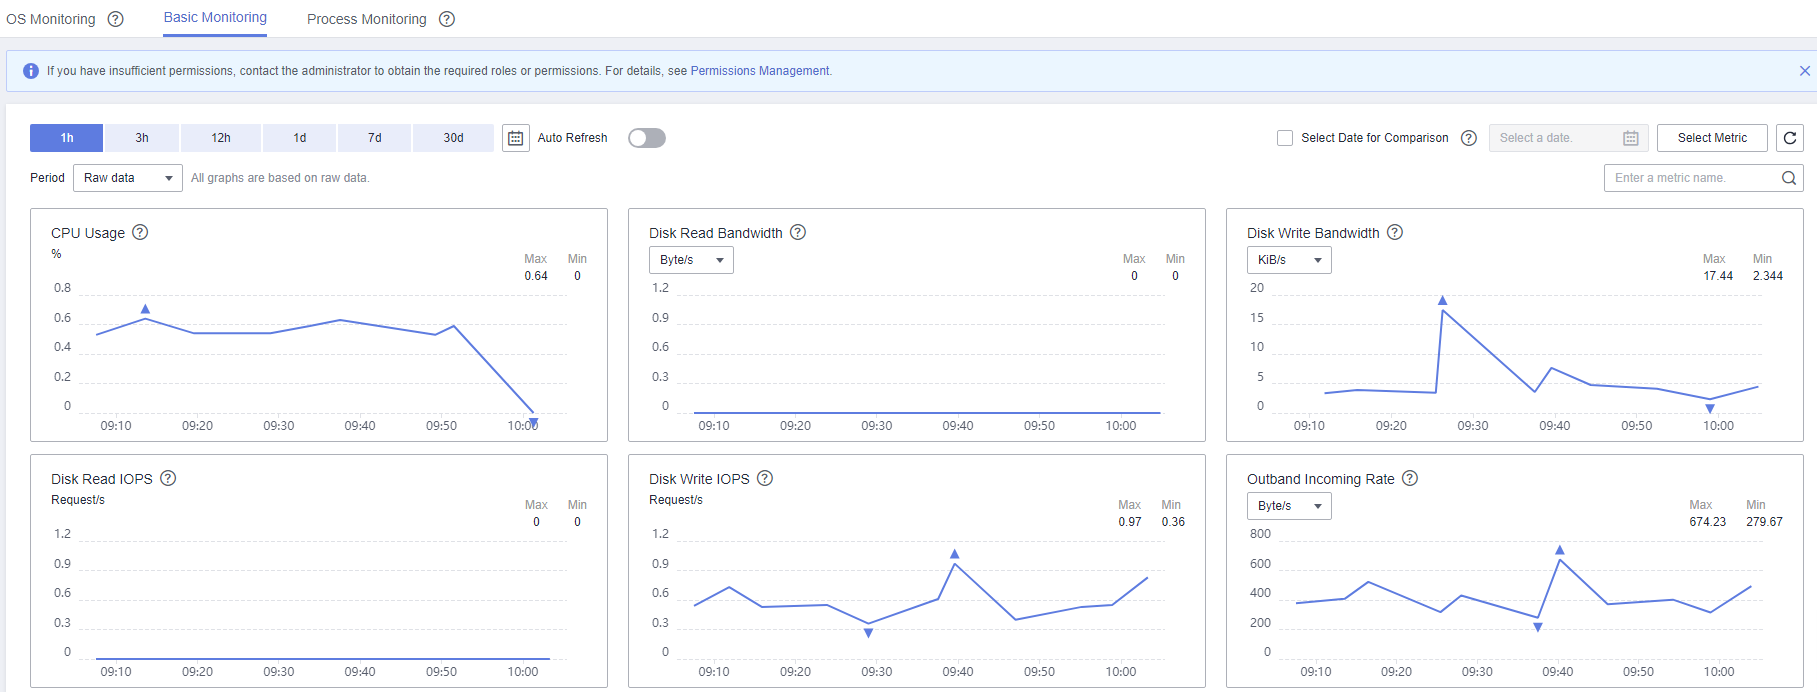
- To view basic monitoring metrics of an ECS, in the left navigation pane, choose Server Monitoring > Elastic Cloud Server, locate the ECS, and click View Metric in the Operation column. Click the Basic Monitoring tab.
Figure 2 Basic Monitoring
- To view OS monitoring metrics of a BMS, in the left navigation pane, choose Server Monitoring > Bare Metal Server, locate the BMS, and click View Metric in the Operation column.
- To view processing monitoring metrics, click the Process Monitoring tab.
- To view OS monitoring metrics of an ECS, in the left navigation pane, choose Server Monitoring > Elastic Cloud Server, locate the ECS, and click View Metric in the Operation column.
- View metrics.
In the upper part of the OS Monitoring page, different metric types, such as CPU, memory, and disk metrics are displayed.
You can view the monitoring data curves of different metrics. Raw metric data is displayed for the monitoring duration of one hour, three hours, 12 hours, and one day. Rolled-up data is displayed for the monitoring duration of seven days or more. Cloud Eye provides the Auto Refresh function at 30-second intervals.
- Hover your mouse over a graph. In the upper right corner, click
 to enlarge the graph for viewing detailed data.
In the upper left corner, you can see six default monitoring periods: 1h, 3h, 12h, 1d, 7d, and 30d. To view historical monitoring data for any period during the last six months, customize the monitoring period by setting Select Range in the upper right corner.
Figure 3 (Agent) CPU Usage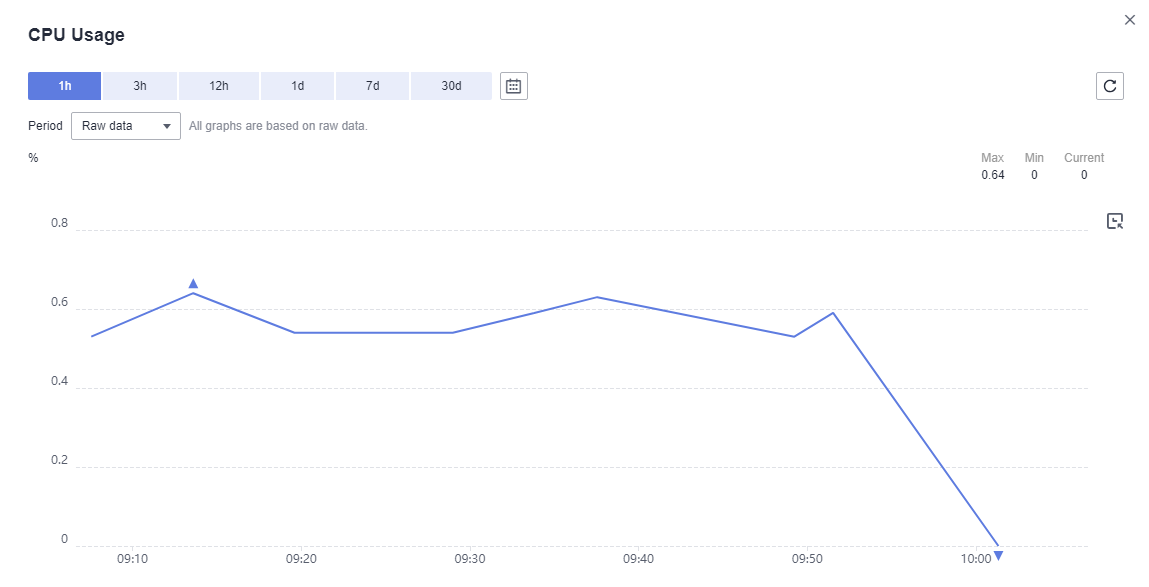
Feedback
Was this page helpful?
Provide feedbackThank you very much for your feedback. We will continue working to improve the documentation.See the reply and handling status in My Cloud VOC.
For any further questions, feel free to contact us through the chatbot.
Chatbot


